¶ Logs
The Logs page is accessible by using the Logs link on the left-side of the hub interface.
This page — most notably the Live logs (the default view) and Past logs tabs — gives you a picture of all of the activity happening in your hub. Depending on your settings, app and device logs (events, raw data coming into the driver as "debug" logs, errors, etc.) may appear here. Watching your logs is one way to troubleshoot your devices or automations if things are not working as expected or to scan for errors or warnings. The Logs page offers several views, accessible from the links at the top of the page, explained below.
It is often best to open your logs in a separate window (or tab) so you can watch them while you work on the Hubitat web interface in a second window. The default logs page, Live logs, starts blank, but data will begin to appear as apps or devices generate log entries.
¶ Live Logs
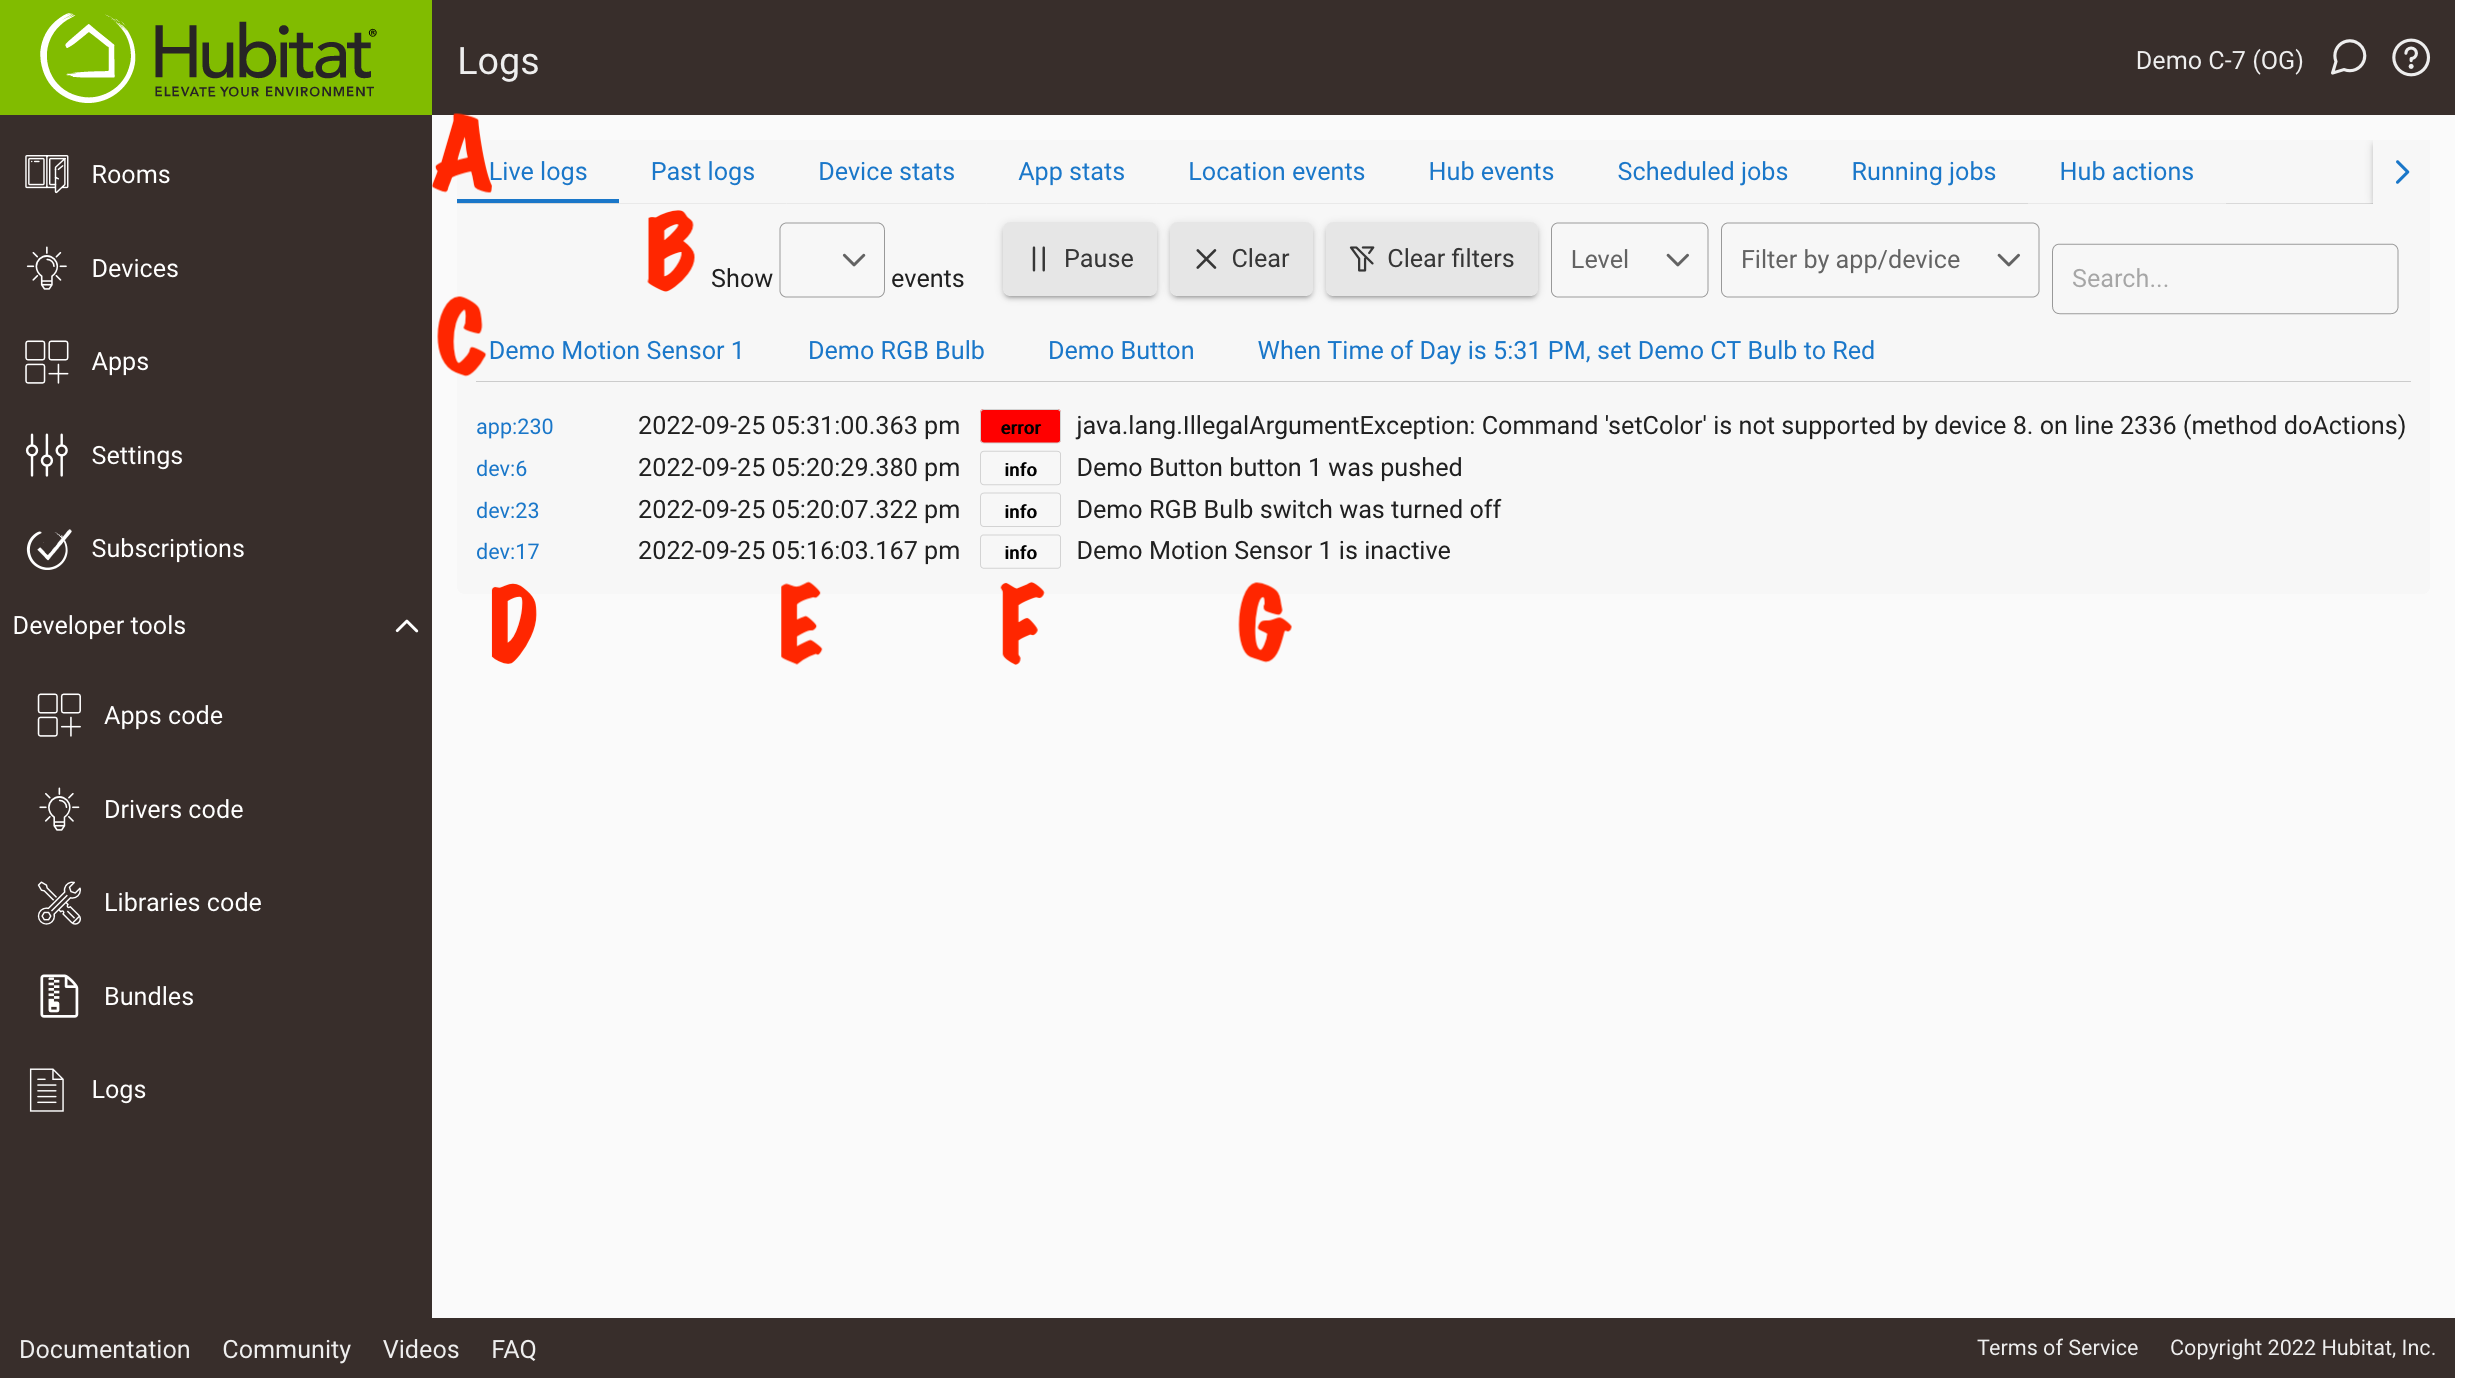
Let's take a look at a sample logs page:

The various parts of the interface include:
- A: Shows the currently selected view (Live logs, in this case – the default) and allows you to switch to another view (on smaller screens, not all titles may fit on the screen; use the arrow icon to show more if needed)
- B: Presents various options for filtering the display of logs:
- Show x events: sets the maximum number of log entries to display
- Pause: prevents newly generated entries from being displayed; select Resume to being showing new entries again (and any generated while paused)
- Clear: hides all currently displayed log entries so that only new entries, generated after this point, will display. (Note that this affects page display only; logs remain on the hub and can be viewed under Past Logs — though if the page is currently open, past logs will need to be refreshed – until they are automatically purged.)
- Clear filters: un-selects any filter options selected below, again showing all log entries
- Level filter: allows you to display only certain log levels: error, warn, info, debug, or trace (or all).
- Filter by app/device: allows selecting one or more apps or devices, and only logs from those apps or devices will be shown in the list
- Search...: Any text typed here will filter the list of log entries to only entries that contain the specified text
- C: As new devices or apps show up in your logs, their names will appear here. Select any device or app name here, and logs will be filtered to entries from only this app or device
- Select Clear filters to see all entries again (or use the dropdown in section B to select additional apps or devices to show)
- Use the expand/collapse arrows in the top right of this section to hide or show this list (hiding may be helpful to have more screen space for logs if you have lots of devices or apps listd; the default is to show, making filtering by name easy)
- D: The app or device ID (internally assigned by the hub but visible in the URL when editing a device or app). Selecting this will also filter the list by the corresponding app or device, just like selecting B.
- E: The date/time that the log entry was generated
- F: The type of log entry, any of info, debug, trace, warn, or error. The info and debug types are generally normal and expected in some cases; errors and warnings may be of concern. See How to Collect Information for Support for more information.
- G: The text of the log entry, often a device event or an action an app is taking.
¶ Past Logs
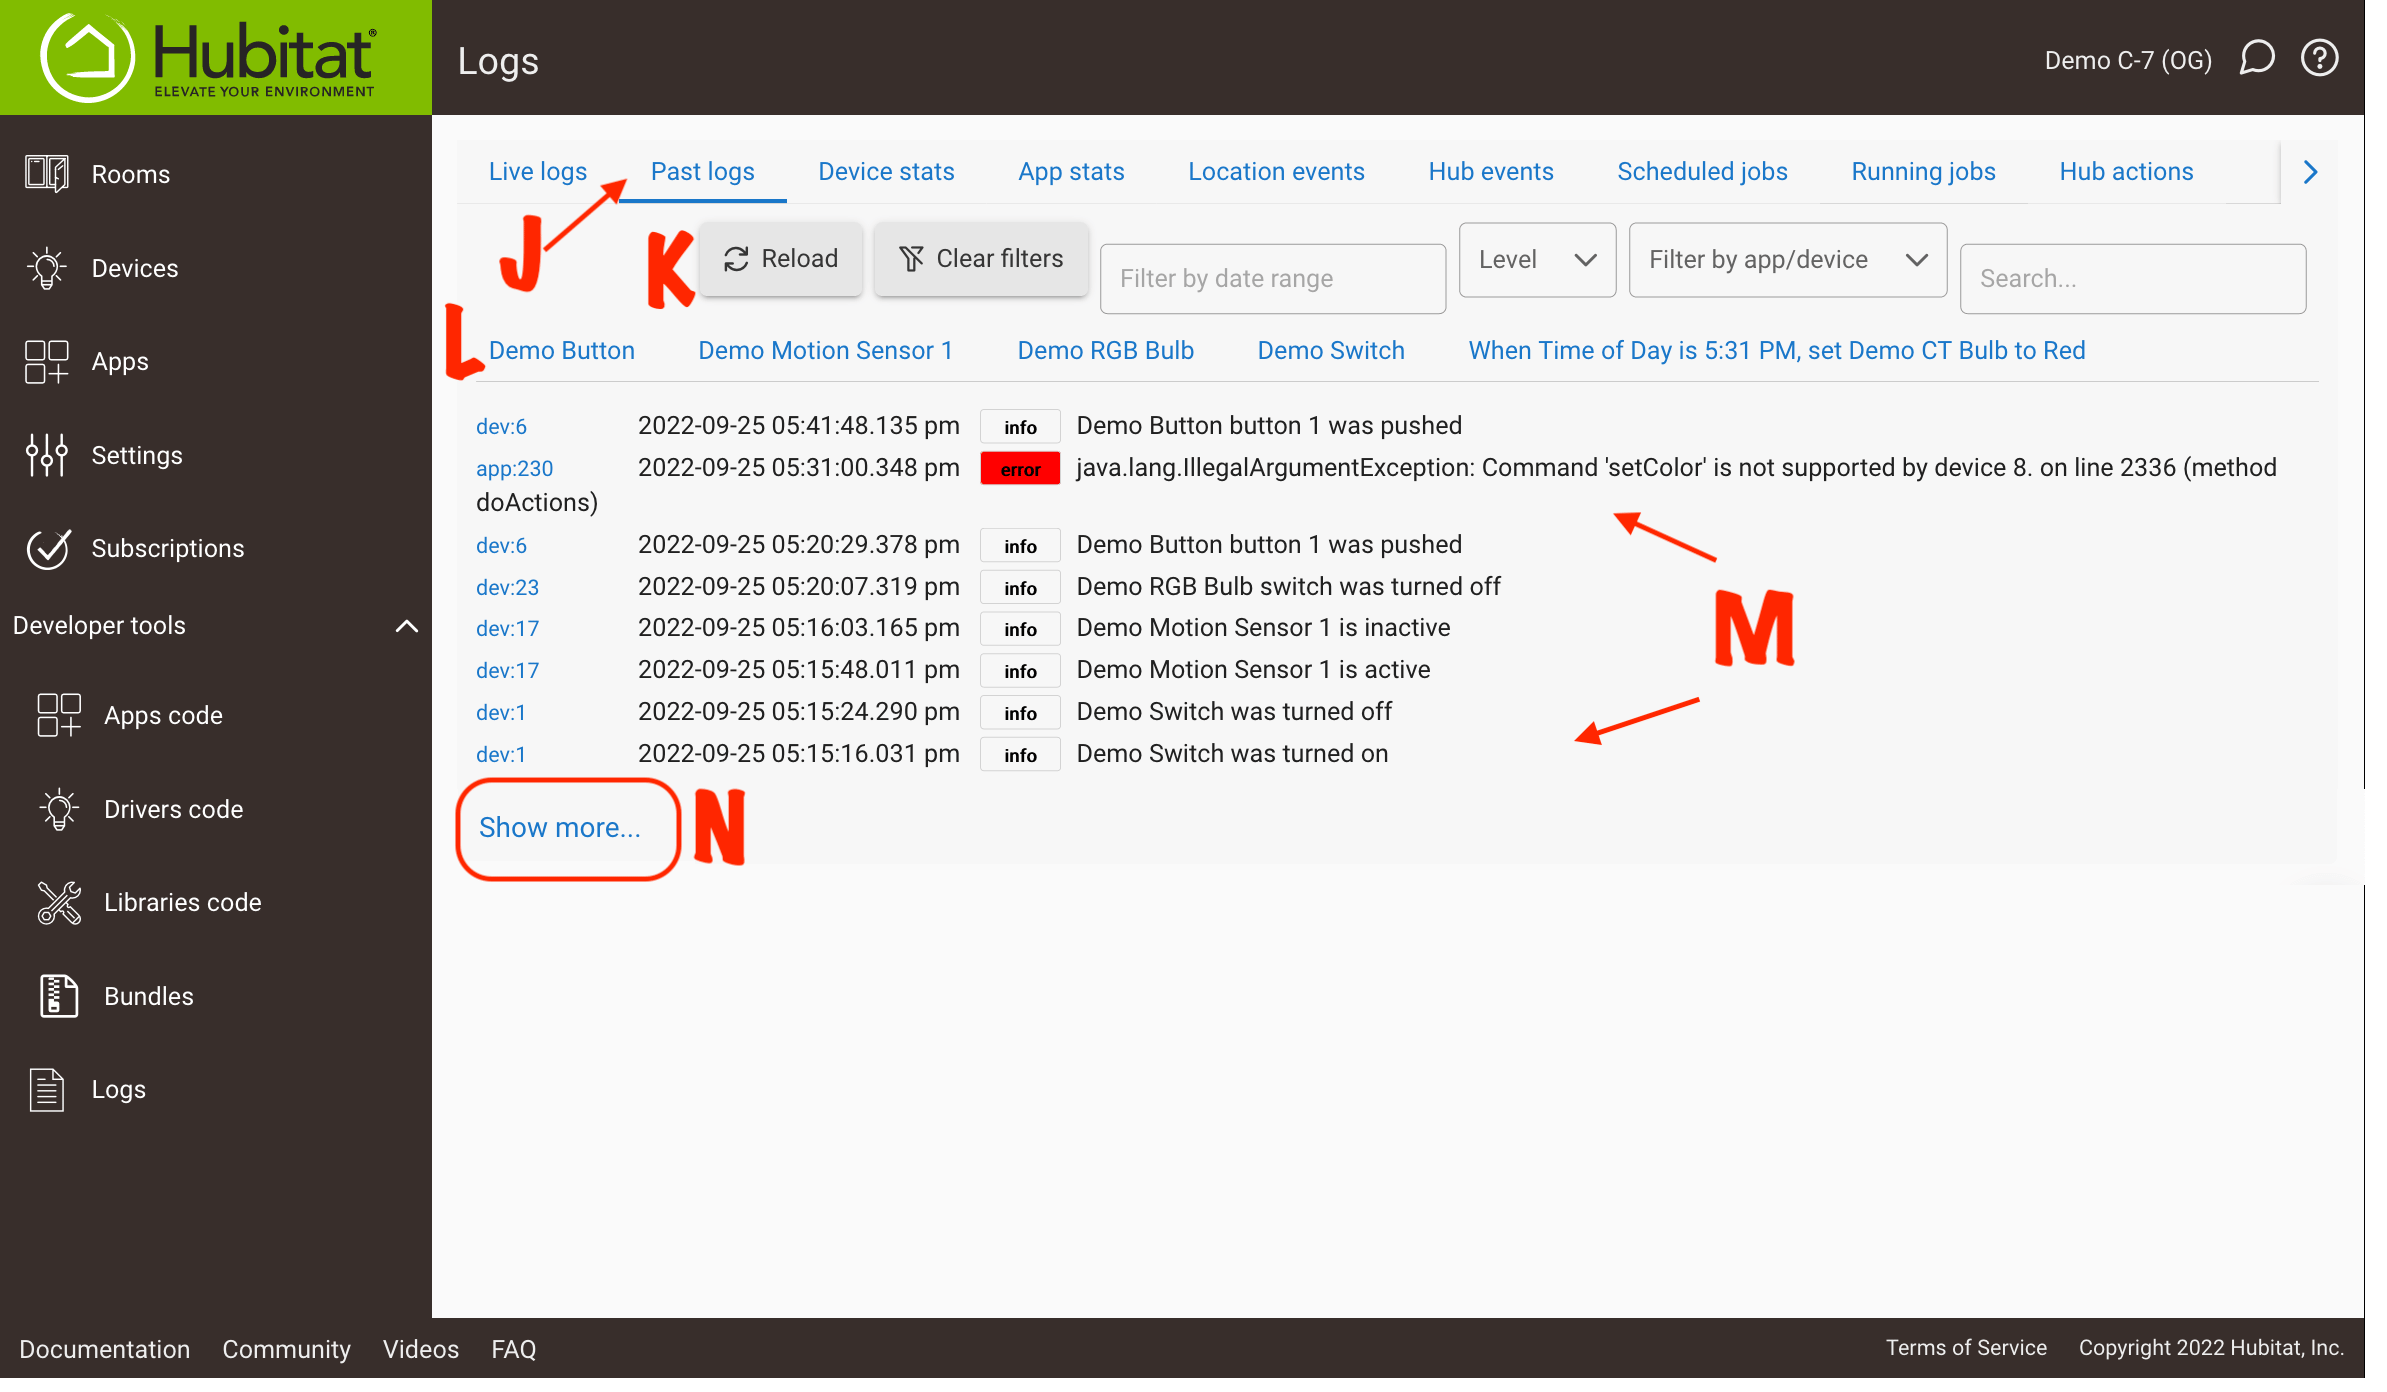
Select Past Logs (labeled J below) to view a recent log history. Unlike Live Logs, this page does not update in real time and contains only entries that existed at the time this page was loaded.

Several filters and other options (labeled K above) are available, most similar to the live logs page:
- Reload: loads past logs from memory again, including log entries that were generated after the Logs page was initially loaded
- Clear filters: un-selects any filter options selected below, again showing all log entries
- Filter by rate range: allows you to choose a specific date range, and only log entries that happened during that range will be displayed
- Level filter: allows you to display only certain log levels: error, warn, info, debug, or trace (or all).
- Filter by app/device: allows selecting one or more apps or devices, and only logs from those apps or devices will be shown in the list (additionally, like love logs, a specific app or device name can also be selected from the list above the logs to easily filter on a single app or device)
- Search...: Any text typed here will filter the list of log entries to only entries that contain the specified text
Log entries (shown in the section labeled M above) display the same information as found in live logs, as described above.
If needed, the Show more... link (labeled N above) can be selected to load additional log entries from history.
The hub has a size-based limit on past logs, around 1 MB. (If you select "Show more..." and no additional log entries load, you have either reached this limit or have filters applied such that no older log entries match your selections.) Old logs will be periodically cleaned based on this size limit, with the oldest logs being removed first. If you find that your past logs do not go back far enough for your needs, the best solution is to minimize unnecessary app and driver logging. Most built-in apps and drivers have options to control these log entries (third-party code may vary; consult the developer if you are unsure). Keep in mind, however, that logging is often helpful for troubleshooting.
¶ Device and App Names
Past Logs will show the oldest name that was in use by the device or app when the first log entry (per the size-based limit above) was generated. These names will appear in the headings (labeled L above) and in the filter drop-down (part of row K above). This may be different from the current name, which will eventually appear instead as older log entries are purged.
Live Logs will show the current name of the device or app as of the first log entry that appears after the page is loaded. This is usually the current name, but it may also become different than the current device or app name (e.g., if the app name changes after the page is loaded). Note that some apps like Mode Manager, Rule Machine, or Room Lighting include parenthetical descriptions (e.g., the current mode name for Mode Manager, or a status like "required expression false" for certain rules) at the end of the app name. These are technically part of the app name itself, meaning that the above descriptions also applicable.
¶ Other Options
- Device Stats and App Stats: allow viewing total and average hub time spent running app or driver code, percentage of total uptime or busy time spent running app or driver code, and other statistics that may be helpful if you suspect an app or driver is causing problems. (Use the Show device settings or Show app settings link at the top to display checkboxes that allow you to choose what statistics to display, if needed.)
- Location Events: see Location Events — recent history of mode changes, sunrise and sunset events, Zigbee or Z-Wave radio status changes, etc.
- Hub Events: See: Hub Events – recent history of startup and shutdown events, hub platform updates, etc.
- Scheduled Jobs: Shows scheduled jobs from all apps and drivers/devices, including the app or device that scheduled it, the name of the method (this may be useful for the developer to know), and the next scheduled execution. This is simply an aggregation of the same information that can be found on the app status or device detail page for an app or device.
- Running Jobs: Any of the above scheduled jobs will show here when they are actually running, including some of the same information (e.g., the app or driver and method name). Ideally, this list will be empty most of the time and populated with only a few jobs for short periods at a time. This page may be helpful to consult if you suspect a long-running job is having a negative effect on your hub.
- Hub Actions: Will list pending Zigbee, Z-Wave, or LAN commands from an app or driver. This will often be blank and, like the above, is likely to be populated for only short periods of time with a small number of entries while an app or driver is sending one of these commands.